Foods high in phosphorus, ranked by milligrams
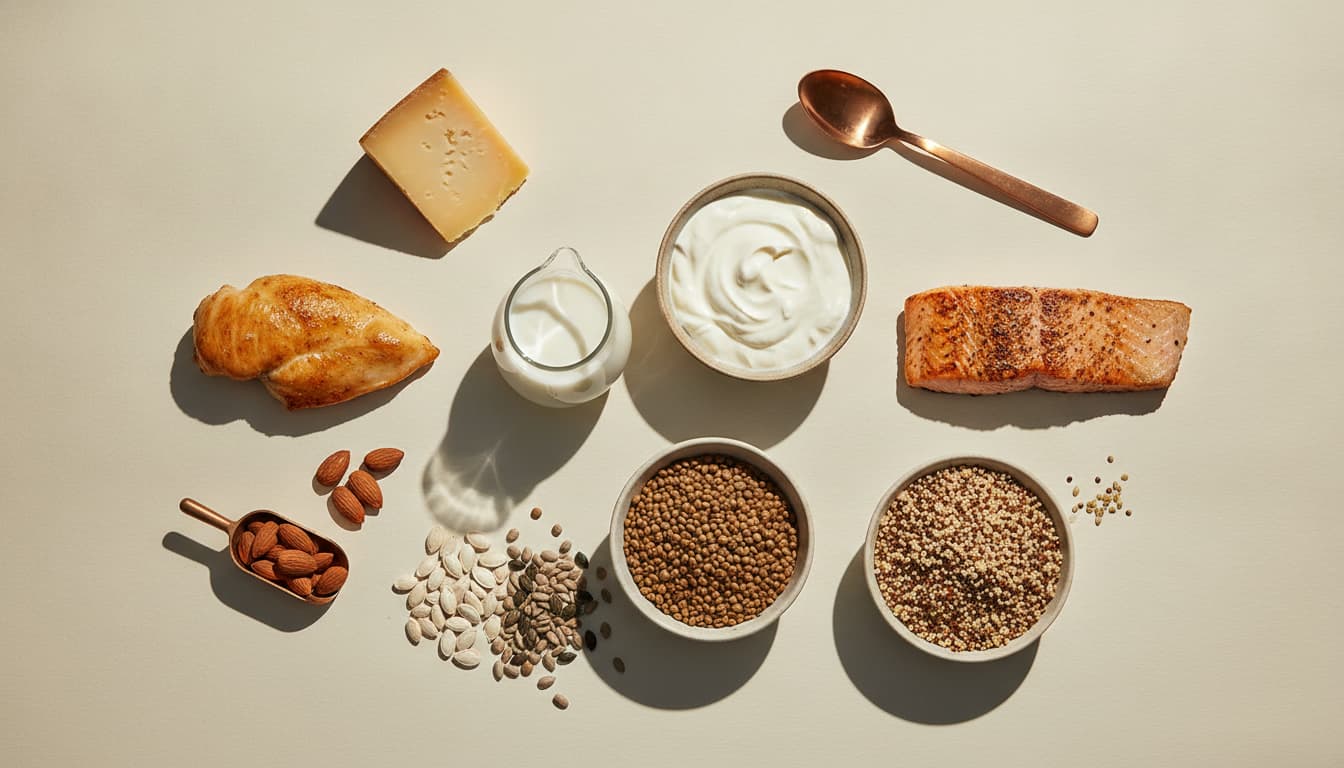
The RDA is 700 mg a day, and dairy, meat, fish, nuts, and beans all supply it in quantity. The mg-per-serving ranking, why the phosphate additives in processed food matter more than the natural kind, and who actually needs to limit it.
- 01
Dairy: ~230-250 mg per cup of milk or yogurt
A cup of milk or plain yogurt carries ~230 to 250 mg of phosphorus and hard cheeses more per ounce, making dairy the densest common per-serving source (USDA FoodData Central). Dairy phosphorus is also well absorbed and comes packaged with calcium in roughly the ratio bone needs. For healthy people this is simply a good thing; for those on a kidney diet, dairy is one of the natural foods that gets portioned because it is both high in phosphorus and well absorbed.
- 02
Meat, poultry, and fish: ~200-250 mg per 3 oz
A 3 oz serving of meat, poultry, or fish supplies ~200 to 250 mg of phosphorus, and organ meats and some fish (like sardines with bones) higher (NIH ODS). Because phosphorus rides along with protein, any protein-adequate diet is automatically phosphorus-adequate. This tight link is why the mineral is never a concern for people eating enough protein, and why it is the protein foods that a renal diet has to account for.
- 03
Seeds and nuts: ~300-350 mg per ounce (pumpkin, sunflower)
Pumpkin and sunflower seeds are among the densest plant sources at ~300 to 350 mg per ounce, with almonds, cashews, and Brazil nuts lower but still substantial (USDA). The caveat is absorption: much of the phosphorus in seeds and nuts is stored as phytate, which humans absorb only partially, so the number on paper overstates what the body takes up. Still, they are a meaningful contribution and, as ever, stack phosphorus with magnesium, zinc, and healthy fats.
- 04
Lentils, beans, and whole grains: ~150-300 mg per serving
A cup of cooked lentils or beans carries ~250 to 300 mg of phosphorus and whole grains like oats and quinoa ~150 to 250 mg per serving (NIH ODS; USDA). As with seeds, a good share is bound as phytate and less than fully absorbed, though soaking, sprouting, and fermenting (as in sourdough) release more. These are the staple plant sources that keep vegetarian diets well above the requirement.
- 05
Phosphate additives in processed food and cola
This is the category that matters most for anyone limiting phosphorus. Processed meats, cheese products, baked goods, fast food, and dark cola drinks contain inorganic phosphate additives used as preservatives and emulsifiers, and unlike natural phosphorus these are absorbed almost completely, not partially (NIH ODS). They often are not fully reflected on nutrition labels. For people with kidney disease, cutting additive-laden processed food is frequently more effective than restricting natural high-phosphorus foods.
- 06
Who actually needs to limit phosphorus
For healthy adults, phosphorus needs no management: the kidneys clear any excess and blood levels stay stable. The group that must limit it is people with moderate to advanced chronic kidney disease, whose kidneys cannot excrete the surplus, leading to high blood phosphorus that weakens bone and calcifies arteries (NIH ODS). For them, a dietitian-guided low-phosphorus plan, prioritizing the avoidance of phosphate additives, is standard care. This is the rare nutrient list where the practical use is restriction, not pursuit.
How this was specified
- 01Inputs measured
- Retail price (dated) · label claim · Certificate of Analysis · third-party test (Informed Sport / NSF / ConsumerLab / Clean Label) · leucine per serving from COA, not marketing.
- 02Protocols tested
- Per-kg target from four literature ranges (IOM RDA, Phillips 2017, Morton 2018, ISSN). Brands scored against Moore 2015 leucine-per-dose threshold (~0.4 g/kg).
- 03Cost-basis verified
- $/gram of protein and $/gram of leucine at warehouse pricing (Costco), mail-order (Amazon), and DTC retail. Re-checked quarterly, flagged when drift exceeds 15%.
- 04Confidence level
- High on ranked order. Medium on absolute $/g (prices drift). Low on serving-size claims where COA is older than 18 months, flagged [VERIFY].
Every claim, cited.
The Larderlab Team builds evidence-led frameworks for eating, lifting, and stocking a kitchen. We cite every claim. We publish the spreadsheet when possible. We buy what we review at retail price. When new data lands, we revise with a dated note.
Next in this hub.
What to Avoid When Taking Collagen: Five Caveats With Evidence Behind Them
Do not count it toward your protein target, do not judge it before 8 to 12 weeks, and if you form kidney stones, know that 30 g of gelatin raised urinary oxalate by 43 percent in a controlled study. The real caveats, and the myths.
8 min · rev 2026-08-24Foods High in Collagen: Why the Real List Is Shorter Than You Think
Collagen exists only in animal connective tissue, so no plant food contains any. Gelatin powder leads at 85.6 g of protein per 100 g, pork skin at 61.3 g. And the most-marketed source, bone broth, tested poorly against supplements.
8 min · rev 2026-08-24Ashwagandha Benefits: What the Trials Show, and the Liver Signal
Pooled across 12 trials in 1,002 people, stress fell with a standardised mean difference of 1.75 and anxiety by 1.55, but heterogeneity was above 83 percent and the certainty of evidence was rated low. The dose that was tested, and the hepatic case series.
8 min · rev 2026-08-24Get the Larderlab Macro Planner.
A Google Sheet that calculates your protein target, splits it across 3-5 meals, and ranks 20 protein sources by $/gram. Free. Copy-and-modify your own version.
By subscribing, you agree to our Privacy Policy. Unsubscribe anytime.