Foods high in manganese, ranked by milligrams
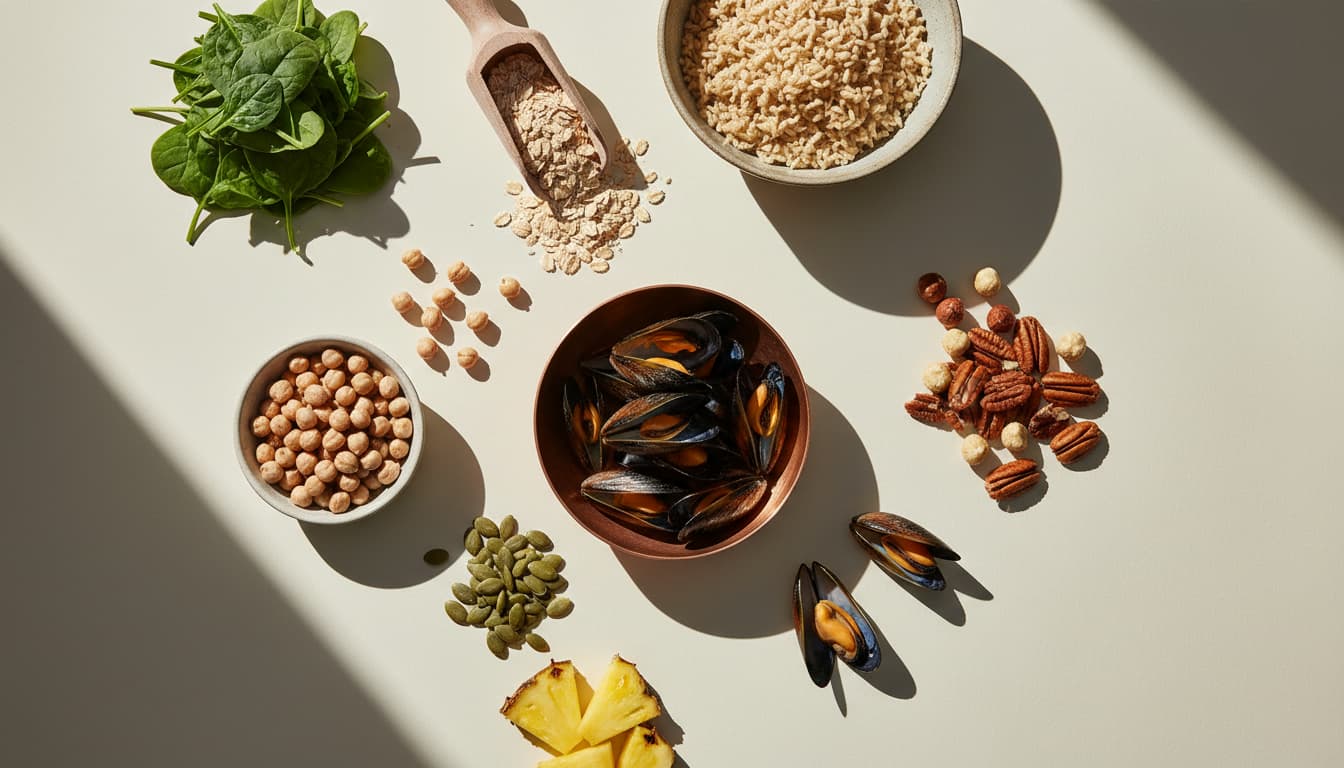
The adequate intake is 2.3 mg a day for men and 1.8 mg for women, and mussels, nuts, whole grains, and legumes clear it with room to spare. The mg-per-serving ranking, why deficiency is essentially unheard of, and why the real risk is excess from water and supplements.
- 01
Mussels: ~5.8 mg per 3 oz, the animal outlier
Cooked mussels are the one animal food that tops the manganese list, at ~5.8 mg per 3 oz, several times the daily target in a single serving, and clams and oysters carry smaller but still notable amounts (USDA FoodData Central). Shellfish are not an everyday food for most people, but for anyone who eats them they cover manganese many times over alongside a strong dose of vitamin B12, zinc, and iron. For everyone else, the plant sources below do the job just as reliably.
- 02
Hazelnuts, pecans, and other nuts: ~1.1-1.3 mg per ounce
An ounce of hazelnuts carries ~1.3 mg of manganese and pecans ~1.1 mg, with pine nuts, walnuts, and almonds lower but still useful (NIH ODS). A small handful covers more than half the daily target, and because nuts are eaten in snackable amounts they add up quickly. As with the other trace minerals, nuts quietly stack manganese with magnesium, vitamin E, and healthy fats, which is why a regular nut habit is such an efficient way to cover several nutrients at once.
- 03
Whole grains: brown rice, oats, and whole wheat
Whole grains are the backbone of manganese intake: brown rice supplies ~1.1 mg per half cup cooked, rolled oats and whole wheat bread contribute a milligram or more per serving, and the mineral sits in the bran and germ that refining removes (USDA). This is why whole grains carry far more manganese than white rice or white bread, and why a diet built on refined grains is lower in it, though still nowhere near deficient given how widespread the mineral is.
- 04
Chickpeas, legumes, and tofu: ~0.7-1.7 mg per serving
A cup of cooked chickpeas carries ~1.7 mg of manganese, with lentils, beans, and tofu in the 0.7 to 1.3 mg range per serving (NIH ODS; USDA). Legumes are the reason vegetarian and vegan diets, far from being short on manganese, tend to be higher in it than mixed diets. Along with the grains and nuts, they make plant-based eating the most manganese-rich pattern there is, no supplement required.
- 05
Spinach, sweet potato, pineapple, and tea: ~0.5-0.8 mg per serving
Cooked spinach supplies ~0.8 mg of manganese per half cup, pineapple ~0.8 mg per cup, sweet potato ~0.5 mg, and a cup of brewed tea a few tenths of a milligram, which adds up for regular tea drinkers (USDA). None is a standout, but these everyday fruits, vegetables, and drinks form a steady background contribution. Tea in particular is one of the larger sources for people who drink several cups a day, a rare case where a beverage matters for a trace mineral.
- 06
The real risk: excess, not deficiency
Manganese is the unusual mineral where the concern runs the other way. Chronic overexposure is neurotoxic, causing manganism, a Parkinson-like movement disorder first seen in miners and welders inhaling manganese dust, and there is ongoing concern about high manganese in some well water and about high-dose supplements (NIH ODS). The tolerable upper intake level is 11 mg a day, and the margin between the target and the ceiling is modest. Because food never causes a problem and supplements can, manganese is a nutrient to get from the plate and nowhere else.
How this was specified
- 01Inputs measured
- Retail price (dated) · label claim · Certificate of Analysis · third-party test (Informed Sport / NSF / ConsumerLab / Clean Label) · leucine per serving from COA, not marketing.
- 02Protocols tested
- Per-kg target from four literature ranges (IOM RDA, Phillips 2017, Morton 2018, ISSN). Brands scored against Moore 2015 leucine-per-dose threshold (~0.4 g/kg).
- 03Cost-basis verified
- $/gram of protein and $/gram of leucine at warehouse pricing (Costco), mail-order (Amazon), and DTC retail. Re-checked quarterly, flagged when drift exceeds 15%.
- 04Confidence level
- High on ranked order. Medium on absolute $/g (prices drift). Low on serving-size claims where COA is older than 18 months, flagged [VERIFY].
Every claim, cited.
The Larderlab Team builds evidence-led frameworks for eating, lifting, and stocking a kitchen. We cite every claim. We publish the spreadsheet when possible. We buy what we review at retail price. When new data lands, we revise with a dated note.
Next in this hub.
What to Avoid When Taking Collagen: Five Caveats With Evidence Behind Them
Do not count it toward your protein target, do not judge it before 8 to 12 weeks, and if you form kidney stones, know that 30 g of gelatin raised urinary oxalate by 43 percent in a controlled study. The real caveats, and the myths.
8 min · rev 2026-08-24Foods High in Collagen: Why the Real List Is Shorter Than You Think
Collagen exists only in animal connective tissue, so no plant food contains any. Gelatin powder leads at 85.6 g of protein per 100 g, pork skin at 61.3 g. And the most-marketed source, bone broth, tested poorly against supplements.
8 min · rev 2026-08-24Ashwagandha Benefits: What the Trials Show, and the Liver Signal
Pooled across 12 trials in 1,002 people, stress fell with a standardised mean difference of 1.75 and anxiety by 1.55, but heterogeneity was above 83 percent and the certainty of evidence was rated low. The dose that was tested, and the hepatic case series.
8 min · rev 2026-08-24Get the Larderlab Macro Planner.
A Google Sheet that calculates your protein target, splits it across 3-5 meals, and ranks 20 protein sources by $/gram. Free. Copy-and-modify your own version.
By subscribing, you agree to our Privacy Policy. Unsubscribe anytime.