Foods high in omega-3, ranked by EPA+DHA per serving
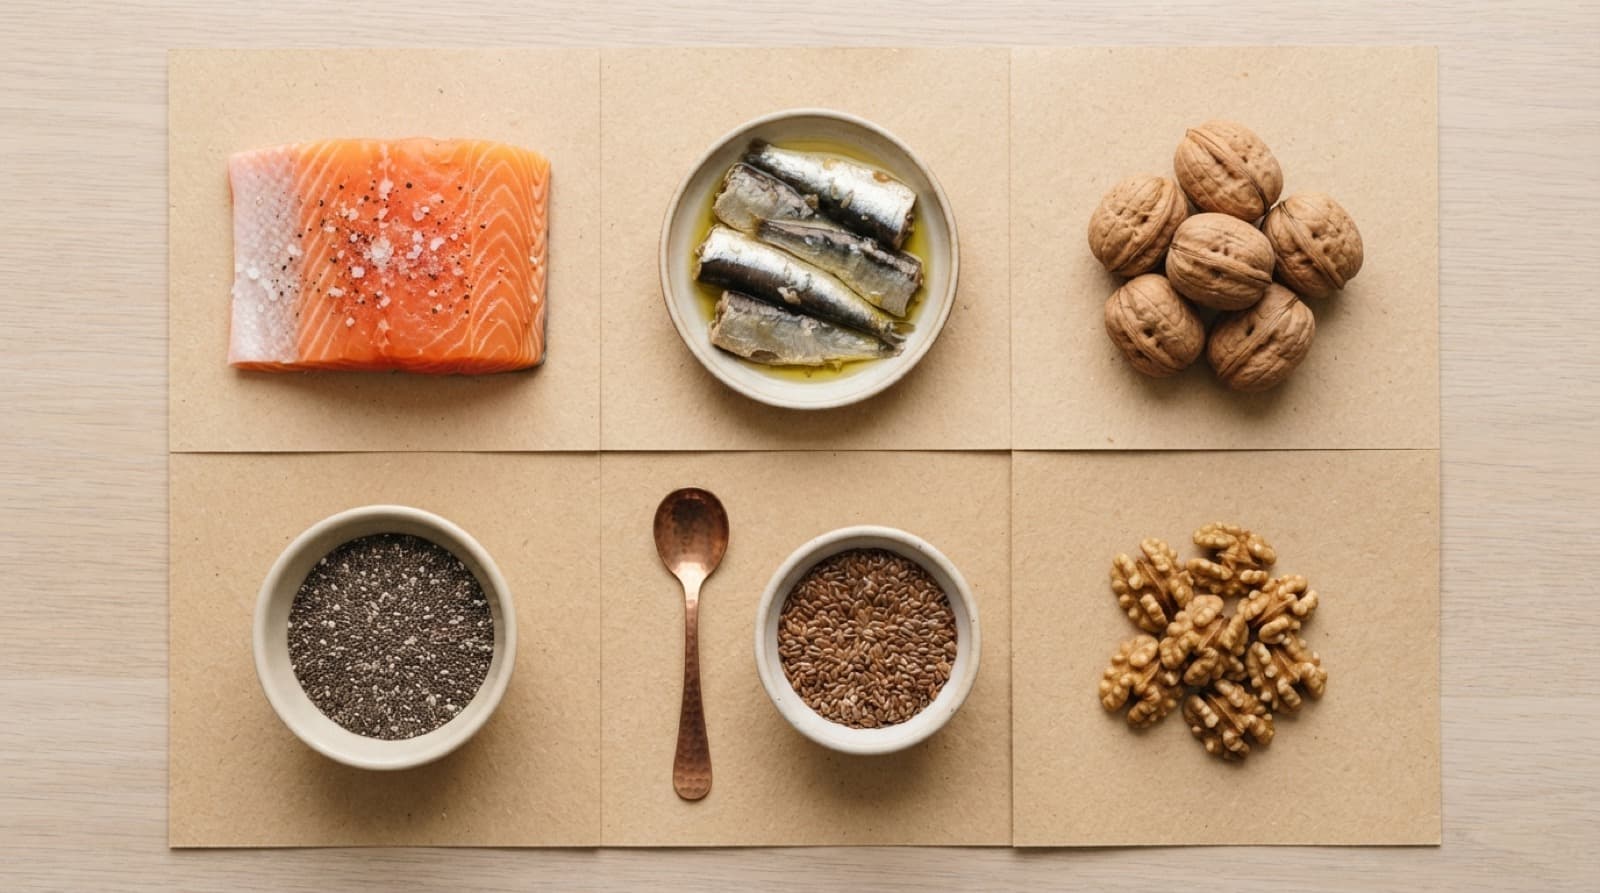
Salmon (~1.5-2 g), sardines (~1.4 g), and mackerel (~2.5 g) per 100 g lead on EPA+DHA. The per-serving ranking, why plant ALA does not count the same, and when food beats a capsule.
- 01
Atlantic mackerel: ~2.5 g EPA+DHA per 100 g
The single densest common source: ~2.5 g of EPA+DHA per 100 g cooked (USDA), roughly 5x a full day's general-health target in one serving. Low mercury as Atlantic/Pacific mackerel (~0.05 ppm, FDA), unlike high-mercury king mackerel. One serving a week alone can average out the 250-500 mg/day goal. The constraint is taste and availability, not omega-3 yield.
- 02
Salmon (farmed or wild): ~1.5-2 g EPA+DHA per 100 g
A 100 g portion supplies ~1,500-2,000 mg EPA+DHA (USDA), with farmed running slightly higher than wild on total fat. Very low mercury (~0.022 ppm, FDA), so it is the default omega-3 fish. Two servings a week averages ~430-570 mg/day, clearing the target from food alone. Canned wild salmon adds edible bones for calcium and is the cheapest reliable route per gram of omega-3.
- 03
Herring: ~1.7 g EPA+DHA per 100 g
~1.7 g EPA+DHA per 100 g (USDA), low on the food chain and low mercury. Sold pickled, smoked, or canned, it is a shelf-stable, inexpensive oily fish that is underused in the US. One 100 g serving covers several days of the general-health target. Watch added sodium in pickled and smoked versions, which is a bigger practical concern here than mercury.
- 04
Sardines: ~1.4 g EPA+DHA per 100 g
~1.4 g EPA+DHA per 100 g (USDA), among the lowest mercury of any fish (~0.013 ppm, FDA) because they are short-lived and low on the food chain. Canned in water or olive oil, shelf-stable, and among the cheapest EPA+DHA sources per gram. Edible bones add calcium. The best cost-per-omega-3 option on the list for anyone who tolerates the flavor.
- 05
Oysters and mussels: ~0.4-0.7 g EPA+DHA per 100 g
Shellfish are a moderate but real source: mussels ~0.7 g and oysters ~0.4 g EPA+DHA per 100 g (USDA), alongside zinc and B12. Lower per serving than oily fish, so they are a supporting source rather than a base. Useful for variety and for people who prefer shellfish; two servings will not hit the target the way salmon or mackerel do, so pair them with a true oily fish.
- 06
Canned light tuna: ~0.27 g EPA+DHA per 100 g
Far lower than the oily fish above at ~0.27 g EPA+DHA per 100 g (USDA), but cheap, shelf-stable, and low mercury as skipjack (~0.13 ppm, FDA). It takes roughly 4-5 servings to match the omega-3 of one salmon serving, so treat it as a protein source with a modest omega-3 bonus, not a primary EPA+DHA vehicle. Skipjack (light) runs ~3x lower mercury than albacore (white).
- 07
Flax, chia, walnuts (ALA): high on paper, ~5-10% usable
This is the list's key caveat. Flax (~2.3 g ALA/tbsp), chia (~5 g ALA/oz), and walnuts (~2.5 g ALA/oz) look omega-3-rich, but they supply ALA, not EPA+DHA, and the body converts ALA at only ~5-10% (NIH ODS). So a tablespoon of flax nets only a few hundred mg of usable EPA+DHA. They are worthwhile foods and the plant route to some conversion, but they do not replace fish for the active forms. Vegans should use algae oil for preformed EPA+DHA.
- 08
When food beats a capsule (and when it does not)
If you eat oily fish about twice a week, you clear the 250-500 mg/day target and a supplement adds little; whole fish also brings protein, selenium, and vitamin D. Supplement when fish intake is low, when a clinician has set a high therapeutic dose for triglycerides, or when mercury from larger fish is a concern and a tested, distilled oil is preferred. Compare a can of salmon against a capsule on $/mg of EPA+DHA in best-fish-oil, and set the number in how-much-omega-3-per-day.
How this was specified
- 01Inputs measured
- Retail price (dated) · label claim · Certificate of Analysis · third-party test (Informed Sport / NSF / ConsumerLab / Clean Label) · leucine per serving from COA, not marketing.
- 02Protocols tested
- Per-kg target from four literature ranges (IOM RDA, Phillips 2017, Morton 2018, ISSN). Brands scored against Moore 2015 leucine-per-dose threshold (~0.4 g/kg).
- 03Cost-basis verified
- $/gram of protein and $/gram of leucine at warehouse pricing (Costco), mail-order (Amazon), and DTC retail. Re-checked quarterly, flagged when drift exceeds 15%.
- 04Confidence level
- High on ranked order. Medium on absolute $/g (prices drift). Low on serving-size claims where COA is older than 18 months, flagged [VERIFY].
Every claim, cited.
- [01]NIH Office of Dietary Supplements. Omega-3 Fatty Acids Fact Sheet for Health Professionals. EPA/DHA vs ALA, ~5-10% conversion, 250-500 mg/day general-health intake.
- [02]USDA FoodData Central. EPA + DHA (omega-3) content per 100 g: mackerel ~2.5 g, salmon ~1.5-2 g, herring ~1.7 g, sardines ~1.4 g, light tuna ~0.27 g.
- [03]Mozaffarian D, Rimm EB. 2006. Fish intake, contaminants, and human health: evaluating the risks and the benefits. JAMA 296(15):1885-1899. ~2 servings oily fish weekly meets the general-health EPA+DHA target.
- [04]FDA/EPA. 2021. Advice About Eating Fish. Mercury levels by species: sardines ~0.013 ppm, salmon ~0.022 ppm, Atlantic mackerel ~0.05 ppm, skipjack (light) tuna ~0.13 ppm.
The Larderlab Team builds evidence-led frameworks for eating, lifting, and stocking a kitchen. We cite every claim. We publish the spreadsheet when possible. We buy what we review at retail price. When new data lands, we revise with a dated note.
Next in this hub.
What to Avoid When Taking Collagen: Five Caveats With Evidence Behind Them
Do not count it toward your protein target, do not judge it before 8 to 12 weeks, and if you form kidney stones, know that 30 g of gelatin raised urinary oxalate by 43 percent in a controlled study. The real caveats, and the myths.
8 min · rev 2026-08-24Foods High in Collagen: Why the Real List Is Shorter Than You Think
Collagen exists only in animal connective tissue, so no plant food contains any. Gelatin powder leads at 85.6 g of protein per 100 g, pork skin at 61.3 g. And the most-marketed source, bone broth, tested poorly against supplements.
8 min · rev 2026-08-24Ashwagandha Benefits: What the Trials Show, and the Liver Signal
Pooled across 12 trials in 1,002 people, stress fell with a standardised mean difference of 1.75 and anxiety by 1.55, but heterogeneity was above 83 percent and the certainty of evidence was rated low. The dose that was tested, and the hepatic case series.
8 min · rev 2026-08-24Get the Larderlab Macro Planner.
A Google Sheet that calculates your protein target, splits it across 3-5 meals, and ranks 20 protein sources by $/gram. Free. Copy-and-modify your own version.
By subscribing, you agree to our Privacy Policy. Unsubscribe anytime.